


The 20 percent plunge in Japanese share prices between August 1 and August 6 wiped out around US$1.2 trillion in the collected savings of Japanese mum and dad investors and large pension funds. The wealth destruction impact of this event was roughly equivalent to 80% of Australia’s top 100 companies becoming worthless overnight. The lingering after-effects of this event will be felt for many years to come.
How the Japanese melt-down was triggered reveals how fragile global asset markets have become and the extent to which rising levels of debt – among consumers, investors and governments – are about to make share markets more volatile.
The Japanese meltdown was triggered by two relatively normal events. First the Bank of Japan, worried about rising inflation, raised its official interest rate to 0.25 percent. Then the US Federal Reserve began hinting that it was about to lower its official rate, currently 5.25%, in several steps.
This modest shift in relative interest rates caused the Japanese Yen to surge in value against the US dollar, triggering a wave of panic selling in all manner of shares and other securities as hedge funds and other big investors began to unwind what have long been known as the “carry trade”. The carry trade is where big funds borrowed money in Japanese Yen (at around 1%) and then invested in assets elsewhere in the world – American bonds or Australian shares for example – where yields were normally above 5%.
The “carry” was the gap between Japanese and overseas interest rates and share dividend yields of 3%-5%. The carry trade was one of the biggest and most profitable bets of the global hedge fund industry, which has US$4.3 trillion under management.
The normally safe carry trade began blowing up in investor’s faces two weeks ago when the rise of the Japanese Yen relative to other currencies meant that the value owed on Yen-denominated loans was getting close to being worth less than the value of the overseas investments on the other side of the carry trade – mostly held in US dollars, Australian dollars and the Euro.
As carry trade positions moved closer to negative the banks lending to Hedge Funds and others playing the game began demanding repayments of debt or calling in collateral, including Japanese shares and bonds, which the banks themselves began to sell.
This uncontrolled wave of selling was joined by another flood of share sales from Japanese mum-and-dad investors, many of whom borrow money to play the stock market. So two groups of relatively desperate sellers were trying to get out the same window at once. The result was carnage.
The key lesson for investors from the Japanese plunge is that today’s asset values – share and real estate prices – are often propped up by piles of hidden debt somewhere else in the universe. And when hidden debt unravels the impact on share prices is ugly.
Since the Global Financial Crisis in 2007-8, big banks have been reluctant to lend on risky bets. But the big banks’ aversion to risk has spawned explosive growth in non-traditional lenders and many of these so-called “shadow lenders” don’t have the processes and controls to assess risk.
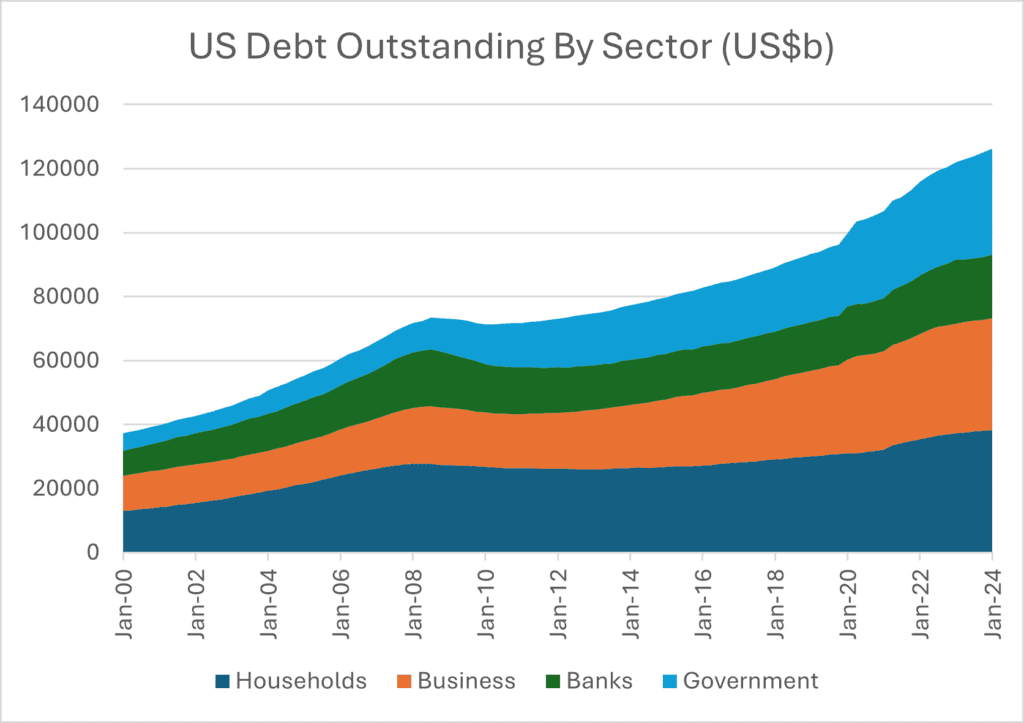
Since the GFC the total amount of “official” debt owed by governments, companies and individuals in the major industrial economies has expanded greatly. On top of this the amount of so-called “private market” debt has also exploded, but as the private market is not regulated there are no reliable statistics on just how much of it has been issued. The following chart shows official debt outstanding as calculated by the US federal Reserve. Add in another trillion or two from the shadow banking sector and, no matter which way you cut it, the American economy has never been so exposed to a breakdown in the debt markets. A chart of other major industrial economy debt levels would look similar but more muted.
The world is long overdue a major correction in equity and real estate valuations, which in many cases trade at or near record levels. When the correction happens you probably won’t see it coming and when it does happen, if Japan is a guide, a 20% reduction in values can happen in as little as three days. When the correction does occur those who have stayed liquid will be sitting pretty.